CHAPTER
7.
UTILITIES AND EFFECTS: DIGITAL SIGNAL PROCESSING
Changing the character of an input signal in the digital domain has been greatly facilitated by the development of DSP chips, particularly since they can imitate the behavior of most analog sound processing devices, such as mixers, delays, filters and analyzers. Other advantages made possible by DSP include smaller hardware size, greater control over noise floors, and ease of reconfiguration — one can write different software specifications to the signal processor, rather than re-soldering hardware components. Many DSP functions are performed by outboard (external) units, and in many cases offer superior quality and more control than their software equivalents. But it will not take long before techniques are improved in conjunction with faster processing power and increased availability of digital signal processors
Digital signal processing in the context of sound software has two basic functions. The first are utility functions that have less to do with creativity than with "housekeeping" chores, similar to the normalization function discussed in Chapter 6. For instance, we might need to change the sampling rate of a sound for compatibility with another medium, or analyze the size of the file to save disc space. In the first section below, we discuss:
![]() sample rate &
quantization conversion
sample rate &
quantization conversion
![]() FFT displays of spectrum
FFT displays of spectrum
![]() soundfile compression
soundfile compression
![]() mixing
mixing
The second basic function of DSP is to create special effects that do anything from slightly alter to completely transform the character of a sound source. These are termed DSP sound modification functions. This application of DSP is a critical part of the creative process of sound composition. In the second section below, we discuss:
![]() time delay
time delay
![]() filtering
filtering
![]() reverberation
reverberation
![]() companding
companding
![]() phase vocoding and
pitch shift
phase vocoding and
pitch shift
Utility functions
Sample rate & quantization conversion
Sample rate conversion is a fairly straightforward, usually one-time process of changing the stored sampling rate of a soundfile; either upwards (up-sampling) or downwards (down-sampling). The interaction with the software usually requires no more from the user than typing in or selecting a desired sampling rate. Many types of sound editing and processing software on both Macintoshes and PCs software offer sample rate conversion routines, but the sound quality can be variable (usually as a trade-off for computational efficiency). Up-sampling and down-sampling are sometimes necessary for creating compatibility between different software or hardware mediums; down-sampling is also performed in order to conserve disc space.
In Chapter 6 you were able to listen to the differences between a sound originally sampled at 44.1 kHz, and then subsequently down-sampled to 22.05 and 11.025 kHz. A sound with no noticeable energy in frequencies above half the sampling rate (the Nyquist rate) can usually be down-sampled to a lower sampling frequency without noticeable audio degradation. However, D-A converters that are part of computer sound cards are usually optimized around only a few sampling rates.
In a similar vein, Figure 6.6 showed the effect of down-quantizing a soundfile from 16 to 8 bits. While a 50% reduction in soundfile size results, the dynamic range is compressed from 96 dB to 48 dB. This means any portion of a waveform that is lower than —48 dB below the maximum of 0 dB VU is literally "lopped off" of the digital word. One way to avoid this is to use audio compression to "boost" the intensity of the analog or digital signal above the lower threshold.
Soundfile compression
Audio compression is different than soundfile compression. Audio compression
refers to limiting the intensity of a waveform to a certain range, as
part of compression-expansion (compander)
processing, and is described later in this chapter. Soundfile compression
on the other hand refers to methods to reduce soundfile size; both an
encoder (“compressor”) and a decoder (“decompressor”) are necessary
to create an audible waveform.
There are a number of available soundfile compression schemes that all function to reduce the disc storage required by a soundfile. These include MPEG layer I and II (Motion Picture Experts Group), MACE (Macintosh Audio Compression and Expansion), and ADPCM (Adaptive Delta Pulse Code Modulation). These techniques usually involve a complex scheme for either eliminating data redundancy, or for eliminating data that is perceptually "transparent" (you shouldn't miss the information if it is there). Some schemes, such as MACE, are designed for real-time processing, while others are slower but of higher quality. Unfortunately, most compression schemes involve a "lossy" process (hence, the term lossy compression), meaning simply that some information will be lost upon compression that cannot be subsequently retrieved. Whether or not this matters is best determined by listening.
Below in Figure 7.1 are some examples of a cymbal crash that has been compressed using the methods just mentioned. Listen to the noise levels, the manner in which the high frequencies die out, and the quality of the attack on the cymbal by the beater. Compare the different compression schemes aurally versus what percentage of disc storage space is saved. If storage is not an issue, compression should be avoided; it's expensive for processing and obviously can introduce artifacts. But in many cases, especially multichannel formats, it opens up many possibilities for audio that might not otherwise exist.
| Scheme | File size | Reduction | Listen: |
| Uncompressed, 16-bit | 120 kbytes | 100% | click here |
| MPEG layer I | 72 kbytes | 60% | click here |
| ADPCM 2:1 | 64 kbytes | 53% | click here |
| MPEG layer II | 60 kbytes | 50% | click here |
| Uncompressed, 8-bit | 60 kbytes | 60% | click here |
| ADPCM 4:1 | 40 kbytes | 33% | clickhere |
| MACE 3:1 (8-bit) | 24 kbytes | 20% | click here |
| MACE 6:1 (8-bit) | 16 kbytes | 13% | click here |
FIGURE 7.1 Table of the storage and auditory effects of various compression schemes on a cymbal crash soundfile. The original file is at top: uncompressed; 16-bit; 22050 sampling rate.
In practice, one needs to compare compression schemes on a case-by-case basis for a particular project; a particular compression method might work with one type of sound but not another.
Mixing
Mixing technically involves the summation of individually-recorded digital
audio channels to a fewer number of channels. We previously introduced
a diagram of a typical analog mixer (see Figure 5.14). The audio mixers
that are provided with software sound editing packages are similar, except
that soundfiles rather than live inputs are "mixed down," typically to
1 or 2 tracks (monaural or stereo). This can be either individual soundfiles,
or the individual tracks within a soundfile.
The most obvious reason to adjust gain of individual tracks is to mix
the relative levels of sound sources to a desired combination, like
the level of speech against background music. But another reason has to
do with the fact that the addition of multiple tracks can easily cause
distortion. For instance, consider mixing two normalized intensity soundfiles
to one soundfile; the total level would be 200% of capacity. On analog
and some software mixers, the signal gain is scaled using fader controls
for each input (see Figure 7.2), while some software mixers have the user type
in a percentage gain scale within an "amplitude" function. Software gain
adjustments must be made to avoid clipping in the output file; some software
will automatically perform this function as an option.
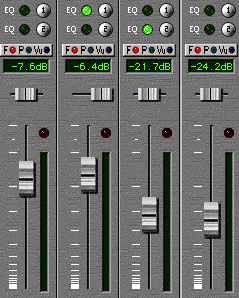
FIGURE 7.2 An example of software faders from Digidesign's Session™ software.
Figure 7.3 shows a schematic version of software mixing. Two soundfiles, one with one track and the other with two tracks, are summed to track one of an output (destination) soundfile. To avoid clipping, each soundfile is gain scaled by a value of 0.5 (—6 dB on the mixer fader seen by the user). A pan (or output assignment) control is usually present, allowing mixing relative left and right levels to a stereo file. Note that in the specific example shown in Figure 7.3 we could have mixed everything to a monaural file, since the pan control is 100% to the left. Panning allows, for instance, mixing the monaural track on soundfile 1 to both channels of the destination file equally, while simultaneously mixing a stereo soundtrack on soundfile 2 by copying tracks 1 and 2 to the same tracks on the destination soundfile. This is common procedure with a monaural narration track against a stereo music track.
Sometimes mixing can be performed in order to form a new type of sound source. In the following example, two sounds with different amplitude envelopes are mixed. The bell (click here) has a quickly decaying amplitude envelope with an immediate attack, while the modulated sound (click here) has a slow attack and variable envelope. Combined, they form a completely different sound (click here). This idea is frequently used as a technique in music composition for acoustic instruments within a traditional orchestra.
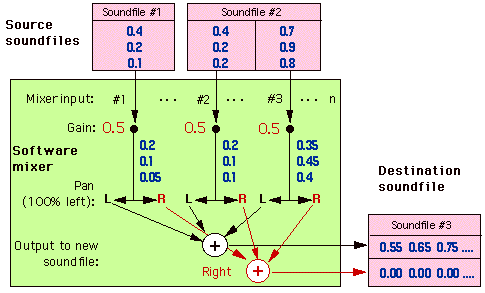
FIGURE 7.3 Schematic of software mixing of two soundfiles (three tracks) to one soundfile (with two tracks).
Spectral Analysis
We can look at the harmonic content of a sound source over a single period
in time by performing a Fast Fourier Transform (FFT) analysis
on the waveform. The ultimate goal is to obtain a spectral analysis
of a sound source, in terms of a two-dimensional frequency-versus-dB
magnitude plot, or a three-dimensional plot that indicates the evolution
of harmonics over time within a waveform. This is useful for determining
optimal frequencies for spectral modification, or for analysis.
The Fourier transform works for sound analysis by mathematically decomposing a complex waveform into a series of sine waves whose intensities and phases can then be determined. Usually, we are more interested in the relative intensities of each of the frequencies analyzed, to determine where spectral energy lies within a soundfile. For instance, Figure 7.4 shows the FFT of a square wave. It should be noted that Fourier analysis works perfectly only when an "infinite" waveform is analyzed. Usually, we need to window a portion of the waveform, which produces errors seen in the "side lobes" of the peaks of Figure 7.4 If it worked perfectly, a picture similar to that shown in Figure 7.5 would result instead, which better matches the theoretical description of a square wave.
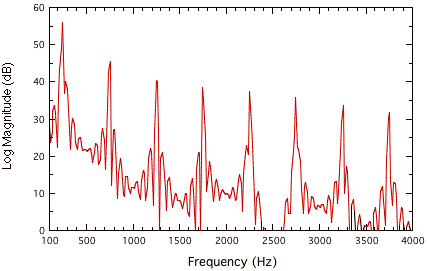
FIGURE 7.4. Fourier transform of the square wave shown in Figures 7.5.
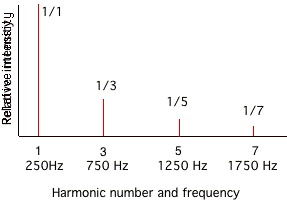
FIGURE 7.5. A plot of the relative intensity for each harmonic component of a square wave, up to the seventh harmonic.
The fact that an FFT essentially "freezes time" makes it less useful for analyzing the temporal evolution of a sound source, although it is usually perfectly adequate for describing a filter or loudspeaker frequency response. In order to get an idea of the temporal evolution of the harmonic structure of a sound, multiple FFTs of a waveform can be taken over successive portions of time. These can then be displayed as in Figure 7.6; the relative intensity corresponds to the color intensity. Figure 7.6 shows both the time and spectral display of a piano note (left) and a cymbal (right). You can click on each picture to associate what you see with what you hear. Note that, in the piano sound on the left, the higher frequency spectral components die out relatively quickly compared to the lower frequencies; while in the cymbal example on the right, the higher frequencies of the complex spectrum are present throughout the sound's decay.
Still another way to view the time-varying nature of the spectral energy of a soundfile is to take multiple FFTs and then arrange them on the z axis of a 3-D graph, as shown in Figure 7.7. This is also termed a perspective (time-intensity-frequency) graph.
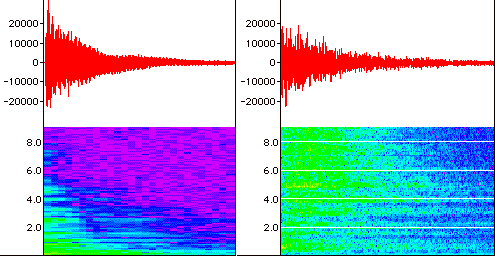
FIGURE 7.6. Time (top) and spectra (below) displays of a piano note (left) and a cymbal crash (right). Time is indicated on the x axis; the y axis is intensity as a function of the quantized sample value from ?32767 (top) or as a function of frequency from 0.1-9.0 kHz (bottom). Click on the display to hear the sound.
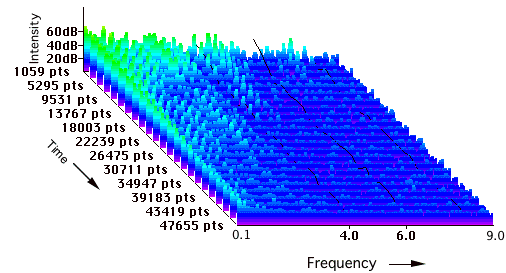
FIGURE 7.7. 3-D spectral display of the piano note. Each time slice (measured in point samples, or pts) indicates a separate FFT, which collectively show the evolution of spectra over the duration of the sound.
Sound modification functions
It's impossible to show every manner in which sound can be modified; else
there would be no room for creativity. Sometimes simple but over-used
techniques like playing a sound backwards (for example, a cymbal: click here, or a tuba— click here) can result in a seemingly stunning effect, but both trained
listeners and the everyday public eventually recognize (and eventually
get bored) by them. Nevertheless, simple is not necessarily bad. On the
other hand, one can choose from a multitude of complex parameters in a
program such as Tom Erbe"s "SoundHack" and end up with either the most
unique sound you may have ever heard, or with something that sounds no
better than backwards. The point is that sound modification is an art,
requiring constant experimentation and sonic feedback. Below, we'll sample
both some common and unique ways for modifying sound.
Time delay
One of the simplest yet most effective methods for altering a sound is
to mix it with a time-delayed version of itself. This is usually done
in tandem with changing the amplitude of the time delayed version. Figure
7.8 shows a two-channel sound file where the lower track is a time delayed,
50% intensity version of the upper track. If the delay is short—below
around 20-40 milliseconds, depending on the sound source—the difference
between an unaltered sound file and a one mixed with a time delayed version
of itself will be heard as a change in timbre. Mixing so that the time
delay is in a separate output channel from the sound source can change
the spatial location and extent of the sound source as well. These effects
result from the constructive and destructive phase interferences discussed
in Chapter 3.
Delay effects are easily simulated with analog delay effects devices; with software editing programs, pasting a section of a silent soundfile before a soundfile track can be used to create the delay. In Figure 7.8, a monaural delay would be formed by mixing the two tracks, while a stereo delay is formed by playing the upper track out the left channel and the lower track out the right. In Figure 7.9, a table of sound examples is given. In particular, compare the sonic difference between the stereo and monaural delays over headphones.
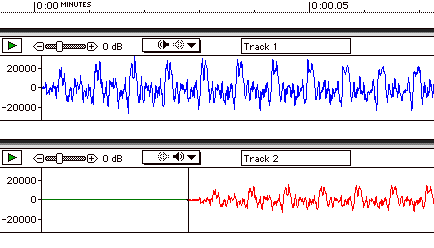
FIGURE 7.8. Time Delay between two soundfile channels.
| Sound (mono-stereo) | Delay time | Delay intensity | listen |
| Piano (mono) | 0.7 milliseconds | 100 % |
click here |
| 20 milliseconds | 80 % |
click here | |
| 100 milliseconds | 80 % |
click here | |
| Piano (stereo) | 0.7 milliseconds | 100 % |
click here |
| 20 milliseconds | 80 % |
click here | |
| 100 milliseconds | 80 % |
click here | |
| Speech (mono) | 0.7 milliseconds | 100 % |
click here |
| 20 milliseconds | 80 % |
click here | |
| 100 milliseconds |
80 % |
click here | |
| Speech (stereo) | 0.7 milliseconds | 100 % |
click here |
| 20 milliseconds | 80 % |
click here | |
| 100 milliseconds | 80 % |
click here |
FIGURE 7.9. Audio examples of adding time delay. Click on the sound label in the first column to hear the original, unaltered version.
Tone controls and graphic equalizers are types of audio filters. These modify the spectral balance of an input sound by selectively emphasizing some frequency components and de-emphasizing others. In Figure 3.1 the graphic equalizer was shown related to overall timbre; filtering was demonstrated in terms of its effect on a piano sound source.
Filters are used to remove or emphasize a region of spectral energy in sound source. They can be used to alter the perceived timbre of a sound, or to remove unwanted aspects of a sound. For instance, many microphones have high-pass filters (HPF) that eliminate any frequency below, e.g., 75 Hz. This filter allows frequencies above 75 Hz (the pass band) through, while attenuating frequencies below this setting (the stop band). Rumble from HVAC systems, passing trucks, and other low-frequency vibrations that can seriously interfere with obtaining a clean recording and preventing distortion are attenuated; few sound sources have energy below this frequency. The high-pass filter B shown in Figure 7.10 has a cut-off frequency of 3 kHz; the pass band is above this frequency and the stop-band is below it. Filters A and C have cut-off frequencies of 1 kHz and 8 kHz, respectively.
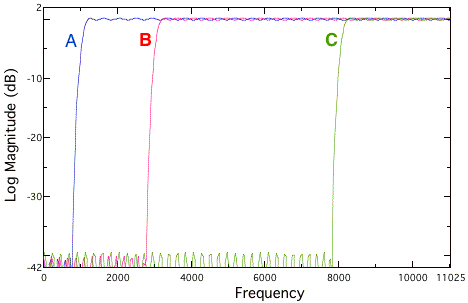
FIGURE 7.10. High-pass filter with cut-off at 1 kHz (A), 3 kHz (B) and 8 kHz (C).
click here to listen to an unaltered noise source; and then
click here to listen to a HPF with a cut-off frequency of 1 kHz;
click here to listen to a HPF with a cut-off frequency of 3 kHz;
click here to listen to a HPF with a cut-off frequency of 8 kHz.
A low-pass filter (LPF) attenuates frequencies above a cut-off frequency. Three low-pass filters are shown in Figure 7.11, with cut-off frequencies of 1 kHz, 3 kHz and 8 kHz; the pass band is above this frequency and the stop band is below it.
click here to listen again to an unaltered noise source; and then
click here to listen to a LPF with a cut-off frequency of 1 kHz;
click here to listen to a LPF with a cut-off frequency of 3 kHz;
click here to listen to a LPF with a cut-off frequency of 8 kHz.
Often, there is not sufficient energy above a certain frequency from the sound source; the overall noise level can be reduced by filtering above this point. Click here to listen to an unaltered noise source; and click here to listen to a LPF with a cut-off frequency of 8 kHz. Notice that the sound is still recognizable, but sounds much cleaner. At the same time, some high frequency information has been lost.
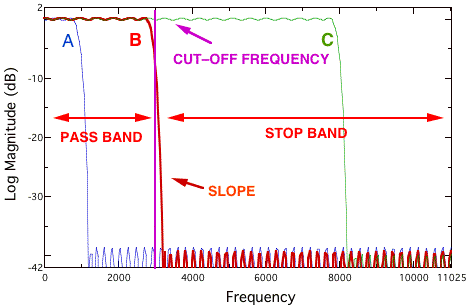
FIGURE 7.11. Low-pass filter with cut-off at 1 kHz (A), 3 kHz (B) and 8 kHz (C).
Another type of filter only attenuates or emphasizes the spectra within a certain region. These are band-pass (BPF) and band-stop (BSF) filters, respectively. Figure 7.12 shows two band-pass filters, with center frequencies of 3 kHz and 9 kHz; and a band-stop filter with a center frequency of 12.5 kHz. The center frequency is the midpoint of the frequency band that is not attenuated (for a band-pass filter) or the midpoint of the frequency band that is attenuated (for a band-stop filter). The bandwidth refers to the width of the spectral region that is passed or rejected, usually measured between the -3 dB (half-power) points.
These filters are the basis of graphic equalizers (EQs). We have indicated the cut-off frequency as the midpoint between the pass band and stop band. No filter can have a perfect transition between stop band and pass band; there is always a transition range that is referred to as the slope of a filter. But the quality of a particular EQ is partly a function of how the narrow the slope is, and the minimum size of the bandwidth. In most cases, equalizers that come with software editing tools have wide bandwidths and broad slopes, allowing real-time modification of a sound for auditioning but simultaneously sacrificing the quality available on an outboard analog or digital equalizer. The band-pass filters in Figure 7.12 would be considered less accurate than the band-stop filter, due to the differences in the narrowness of the slope.
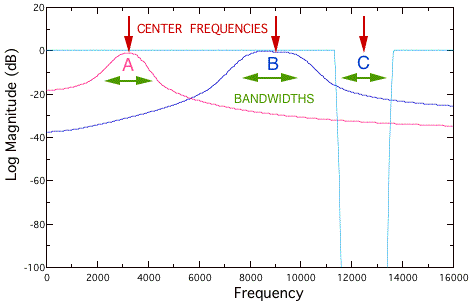
FIGURE 7.12. Band-pass (red, blue) and band-stop (light blue) filters .
Reverberation
Natural reverberation is the effect of an environmental context on the
sound quality of a sound source. We are more aware of reverberation inside
of the enclosed spaces that we occupy in daily life, but reverberation
is also present in many outdoor situations. Only in anechoic chambers
or in atypical environmental conditions, such as within a large, open
expanse of snow-covered ground or on a mountain summit, are sound sources
ever non-reverberant.
A sound source's direct sound is defined as the wave front that reaches the ears first by a linear path, without having bounced off a surrounding surface. Reverberation on the other hand refers to the energy of a sound source that reaches the listener indirectly, by reflecting from surfaces within the surrounding space occupied by the sound source and the listener. Reverberation can be thought of as a large collection of time delayed versions of a sound source that decay in intensity over time as they arrive at the listener (see Figure 7.13).
The direct and time-delayed sounds arrive so quickly in succession after the initial waveform that they are perceived as one separate sound source, arriving from a single location defined by the direct sound (click here). However, if the reflection arrives late enough in time, it is heard separately as an echo (click here), similar to the simple time delay described above.
Reflected energy is categorized in terms of early and late reflections due to both physical and psychoacoustic criteria. The early reflections of a direct sound are followed by a more spatially diffuse reverberation termed late or dense reverberation. These later delays result from many subsequent reflections from surface to surface of the environmental context. In a typical room, the buildup of successive orders of reflections begins to resemble an exponentially decaying noise function during the late reverberation period, causing individual reflections to be lost in the overall energy field.
Figure 7.14 shows an impulse response of a real room, obtained by recording a loud impulsive noise with an omni-directional measurement microphone. Figure 7.14 also shows identification of two possibly significant early reflections. Significant early reflections, those with a significant amplitude above the noise floor, reach the receiver within a period around 1—80 msec, depending on the proximity of reflecting surfaces to the measurement point.
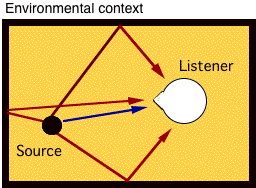

FIGURE 7.13. Top: Direct sound (blue) and early reflections (red). Below: reflectogram showing direct sound (green), early reflections (red) and reverberation (blue).
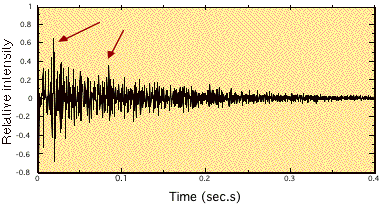
FIGURE 7.14. An impulse response measured in a classroom with an omnidirectional microphone. Arrows indicate significant early reflections.
The longer that it takes reverberation to decay, the larger the enclosure is perceived to be. This is related to the reverberation time control in software and hardware reverberators. This is probably the most perceptually salient aspect of natural reverberation. Changing the ratio of direct to reverberant sound (the R/D ratio) at the recording device is also a powerful cue, and can create powerful cues for auditory distance. This is because as we move away from a sound source, the level of the sound coming from reverberation remains more or less constant while the level of the direct sound is diminished.
The R/D ratio is typically controlled on a hardware device by the level of the effect control (the "wet" portion of the output of the device), relative to the level of the "dry" signal (unaltered portion of the signal). On an analog mixer, the level of the effects send and return controls is the way the R/D ratio is altered (see Figure 5.14 for an illustration of effect send and return). Sound examples were provided in Figure 5.13 on how changing the microphone distance and pickup pattern could alter the amount of reverberation. One way to simulate the R/D ratio using sound editing software is to open two versions of a soundfile; one completely dry, and one as wet as one would possibly want. By using the software mix function, and altering the relative levels of each soundfile, you can control the wetness of the resulting sound in the output (mixed) file.
Often, the goal of reverberation is to provide just a small suggestion of room quality ("ambiance") to a "dry" sound. A particular recording environment is often chosen for its reverberation characteristics (for the same reason people like to play music in stairwells and in subways). However, there is no reason to imitate natural reverberation; one can create a myriad of effects. One interesting effect involves placing sounds in unexpected reverberation situations, such as the little boy somewhere in an empty Taj Mahal (click here).
In the examples in Figure 7.15, you can compare a sound processed with different wet-dry (R/D) ratios and with different reverberation times. The reverberation was synthesized using a commercially-available outboard DSP device. The reverberation possible with sound editing software can be particularly disappointing. For instance, here is a sound reverberated with a "large hall" setting (click here), compared to the same sound reverberated using an studio-quality outboard reverberator (click here). On the other hand, the cutting-edge approach of combining 3-D sound and reverberation techniques for auralization allows for the most realistic and potentially exciting results (see Chapter 9).
| Sound | R/D ratio | Reverb time | listen |
| Piano | small | 0.3 seconds | click here |
| 1.0 seconds | click here | ||
| 2.5 seconds | click here | ||
| large | 0.3 seconds | click here | |
| 1.0 seconds | click here | ||
| 2.5 seconds | click here | ||
| Speech | small | 0.3 seconds | click here |
| 1.0 seconds | click here | ||
| 2.5 seconds | click here | ||
| large | 0.3 seconds | click here | |
| 1.0 seconds | click here | ||
| 2.5 seconds | click here |
FIGURE 7.15. Examples of variation in reverberation time and level. Click on the sound label in the first column to hear the unaltered version of the sound.
Compression-expansion
Audio compression-expansion is sometimes referred to as companding.
As mentioned previously, the goal of audio compression refers to limiting
the intensity of a waveform to a certain range that is narrower upon output
compared to input. Expansion has the opposite goal; the purpose is to
boost the intensity of an input signal that falls below a certain threshold.
When used together, it is possible to narrow the dynamic range of a sound
to a more limited range than it has normally. This is very important in
broadcasting; one of the reasons a radio announcer's voice sounds so consistent
in volume is due to the use of companders. Almost all popular recordings
are compressed as well, so as to sound good on a wide variety of equipment.
Recall that the dynamic range of the playback environment is much narrower
than that of the real world (see Figure 2.4). This also applies to down-quantizing
a soundfile from 16 to 8 bits, as discussed previously
in this Chapter.
One can go beyond the approach of using compression-expansion just for a practical result. Figure 7.16 shows examples of an unprocessed and a compressed and expanded cymbal crash. Note that the quieter parts are louder, and the louder parts are quieter. Note also that the natural decay of the cymbal into the noise floor has been eliminated.
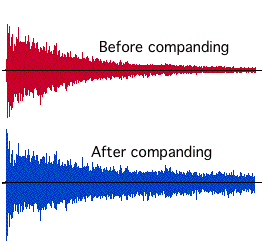
FIGURE 7.16. Effect of companding on the intensity of the signal. Click on each example to listen to the effect.
The interface to a compander is complex. The best way to become familiar with the various parameters is to work with a real-time outboard device, or to relentlessly use software processing, until a sense of what is gained versus what is sacrificed is achieved. Figure 7.17 shows the interface from the "dynamics effects" menu available with Digidesign"s Audiomedi™ and Sound Designer™ software packages; similar controls are found on most software and outboard devices. The "threshold" fader is probably the most important control. Compression occurs only when the signal goes above the level indicated (or, for expansion, when a signal goes below this level). The "detect" fader allows a transition between evaluating individual samples versus evaluating the mean value of a group of successive samples. "Attack" and "release" affect how quickly the effect is activated; its function is to smooth the effect of compression or expansion for a more natural sound. The "ratio" controls the overall amount of the effect. For compression, a 10:1 ratio means that a 10 dB increase in the input results in a 1 dB increase in output, for expansion, a 1 dB increase at the input results in a 10 dB increase in output.
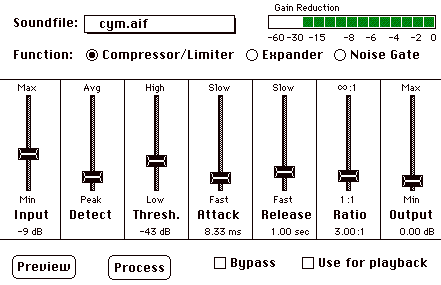
FIGURE 7.17. Dynamic processing interface from Digidesign™ Audiomedia·and Sound Designer·software.
Phase vocoding: pitch shift; varispeed
You heard with some of the examples played in Chapter
4 that it is possible to greatly alter the character of a sound using
a simple pitch shift. This technique is accomplished
by playing back a sound at a lower or higher sampling rate than the original
sound was recorded at. This is equivalent to changing the speed on an
analog tape. Note that as you change the pitch, the duration of the sound
changes proportionally. For example the following sound (click here) has an animal-like character, somewhat like a seal or a sea
lion. It was produced by shifting the pitch of a lovebird call downwards
by 2 octaves (25% of the original frequency— click here).
More creative pitch shift effects can be obtained by varying the amount of pitch shift over time. In Figure 7.18 a pitch shift that follows the pattern of a sine wave is applied (using SoundHack software). Three cycles of the wave are applied across the total duration of the processed waveform. One can choose from a number of different built-in functions, or define a custom pitch function.
click here to listen to the original soundfile; and
click here to listen to the pitch-shifted version.
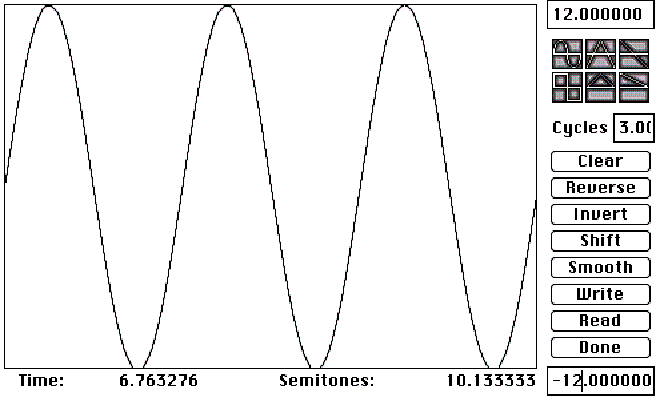
FIGURE 7.18. Pitch shift function from SoundHack. Click anywhere on the figure to listen to its effect.
We pointed out that pitch shifting alters the duration of a soundfile proportionally. But what if you wanted to shift the pitch of a sound without changing its duration? Or, conversely, change the duration but not the pitch? A process known as phase vocoding is a way to accomplish this.
Phase vocoding (termed pitch shift or time compression-expansion in some software packages) involves a non-realtime, computationally-intensive analysis-synthesis technique. The analysis involves calculating the waveform's spectral energy via a series of band-pass filters, in a time-to-frequency analysis. This can be thought of as a series of FFTs that occur over the duration of the soundfile. Once the signal is analyzed, it possible to synthesize the original input signal via a frequency-to-time operation known as an inverse FFT. The advantage of the process is that during synthesis, one can alter parameters to result in time change without pitch shift, or pitch shift without time shift.
Best of all for producing special effects, the phase vocoder requires an exact, usually unpredictable set of parameter adjustments to create a "perfect" unprocessed-sounding result. Usually, some artifacts remain from the analysis-synthesis procedure; these artifacts can be in fact exploited for their own contribution to the effects, for instance, by setting parameters to below recommended limits. These parameters include the amount of overlap and the number of filters that occur during the analysis stage. Some software simplifies these parameters into a simple "quality versus processing time" slider control.
click here to listen to the original soundfile;
click here to listen to the time-shifted version that has the same pitch;
click here to listen to the pitch-shifted version that has the same duration; and
click here to listen to a time-shifted version, where a "lower quality" yields a special effect.