CHAPTER
3.
AUDIO BASICS III: SPECTRA, MODULATION AND PHASE
Spectra and Harmonics
Most sound sources contain multiple vibration frequencies (“modes
of vibration” ) that occur when the source is activated. While a
sine wave is considered technically to be a “simple” waveform,
almost all waveforms in nature are in actuality “complex,”
in that they contain multiple frequencies that make up the spectrum
(plural, spectra) of a waveform. The reason
a piano or the oboe doesn't sound like a sine wave is because every sound
source has its own unique spectrum. Click each of the buttons below. Each
sound source has an identical musical pitch, but a unique spectrum, allowing
us to categorize each sound source as unique:
| Push |
The recording process and signal processing can radically alter a sound’s
spectrum. Each of the sounds are from the same piano sound source but
the spectra has been altered by digital filters.
A filter is most often used in audio to alter the spectrum of a sound.
| Push |
The way you're probably most familiar with spectral modification is by modifying a sound source using a tone control, or a graphic equalizer. These modify the spectral balance of an input sound by selectively emphasizing some frequency components and de-emphasizing others. Figure 3.1 shows a typical graphic equalizer setting from a software editing package.

FIGURE 3.1. The
infamous "disco curve": lots of bass and some treble emphasis.
The spectrum of a sound source, along with the manner that the content
changes over time, is largely responsible for the perceptual quality of
timbre, sometimes referred to simply as “tone color.” Timbre
is sometimes defined in terms of what it is not? “the quality of
sound that distinguishes it from other sounds of the same pitch and loudness.”
Everyone is innately pretty good at recognizing and distinguishing between
different timbres. There's evidence that babies can distinguish between
mom's voice and another person’s early in life. Conrad Lorenz was
one of the earlier workers who found that birds inside of the egg are
imprinted with their mother's voice, or whomever happens to be making
continual sounds; if a human peeps at an egg for long enough, the baby
bird will recognize that human as “mom.” For example, most
people have a friend who owns a car or other means of transport that you're
pretty familiar with; imagine that you're waiting for that person to pick
you up on a busy street corner. You’ll hear hundreds of different
vehicle sounds, but you can probably distinguish the sound of his or her
particular automobile, motorcycle, bicycle, skateboard, etc., before you
see it.
There are still more complicated explanations for distinguishing between
and identifying different timbres. For instance, some workers have found
that if you think a loudspeaker looks inexpensive visually, you’ll
think it has worse sound than one that you think looks expensive. Other
research suggests that the following are important:
![]() the range between
pitch and noise-like character;
the range between
pitch and noise-like character;
![]() the spectral envelope
(the evolution of spectra over time);
the spectral envelope
(the evolution of spectra over time);
![]() the overall rise,
duration, and decay of intensity;
the overall rise,
duration, and decay of intensity;
![]() small pitch changes
in both the fundamental frequency and the spectra;
small pitch changes
in both the fundamental frequency and the spectra;
![]() information contained
in the onset of the sound, as compared to the rest of the sound.
information contained
in the onset of the sound, as compared to the rest of the sound.
Luckily, we can use that most accurate measuring device, our hearing system,
to make most of the distinctions that are necessary.
Each individual frequency that makes up an individual sound’s waveform
is termed a partial. The partial with the
lowest frequency in a complex sound is termed the fundamental.
Often, but not always, a sound's pitch is mostly influenced by the frequency
of the fundamental rather than by higher partials; in many cases fundamental
frequency has more energy than the other partials. Each of the examples
heard on page 3.1 had identical fundamental frequencies, in terms of Hz.
However, their intensity behaved differently over time, providing another
cue for timbral differences.
The simplest types of partials are called harmonics.
These are vibration modes where the partials are a simple multiples of
the fundamental. You may be familiar with harmonic partials from a guitar
string. If you pluck a string you hear the lowest frequency as the pitch.
If you lightly touch the string at its half way point (see Figure 3.2),
you'll hear a tone an octave above, or at the first harmonic. Touching
the string so that its length is divided into a ratio of 3:2 , and you'll
hear a pitch at a perfect fifth plus an octave above the fundamental;
and so on. Stopping the string at different locations causes the string
to vibrate in different modes. The simple-ratio divisions of the string
correspond to the overtone series (or harmonic series) seen at the right
of Figure 3.2.
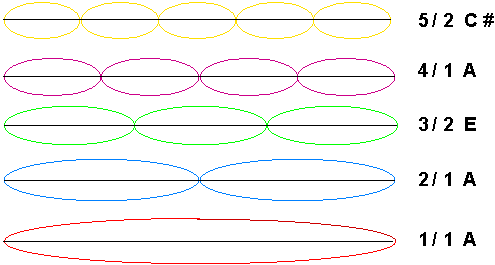
FIGURE 3.2. Producing
different harmonics on a guitar string by stopping the string at points
corresponding to simple rations (left); the equivalent musical pitches
that make up the overtone series (right). Click on each string or the
note to hear the pitch.
An interesting phenomenon related to spectra is that of fundamental
tracking, which explains how one can hear the pitch of a bass player
on a 2-inch radio speaker incapable of reproducing that frequency. In
most cases, the ear determines the pitch at the correct fundamental based
on the harmonic relationship of the higher harmonics that the speaker
is capable of reproducing.
There are other simple periodic waveforms other than the sine wave that
can be produced on analog synthesizers, test equipment, and FM synthesis
using an electronic oscillator. One can produce
a triangle wave, which is composed of a fundamental
frequency with partials at even numbered multiples: 1 * the fundamental
frequency f, 2* f, 4 * f, 6 * f, , etc.. (push
here to hear a triangle wave with a fundamental at 250 Hz). Or one
can produce a square wave (see Figure 3.3),
which is composed of a fundamental frequency with partials at odd numbered
multiples: 1 * the fundamental frequency f, 3 * f, 5 * f, 7 * f, , etc..
(push here to hear a square wave with a
fundamental at 250 Hz). In both cases, the intensity of each harmonic
is the reciprocal of the harmonic relative to the fundamental. For the
square wave, given a fundamental at 250 Hz, the partial at 750 Hz will
be one third the intensity, the partial at 1250 Hz will be one fifth the
intensity, etc.
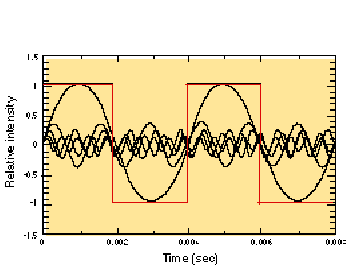
FIGURE 3.3. A square wave (in red) superimposed over sine waves that represent its first five odd-numbered partials (250, 750, 1250, 1750, and 2250 Hz). An actual square wave would be composed of successive odd-numbered harmonics up to the highest frequency capable of being produced by the audio system (in a digital system, almost half the sampling rate).
A sawtooth wave contains both even and odd harmonics; like the square
wave, each harmonic’s amplitude is the reciprocal of the harmonic
number. Figure 3.4 shows two ways of describing a sawtooth wave. In the
inset, the time display of the sawtooth waveform is shown as a function
of intensity. Figure 3.4 also shows a graph of the relative intensity
of each of the first five harmonics.
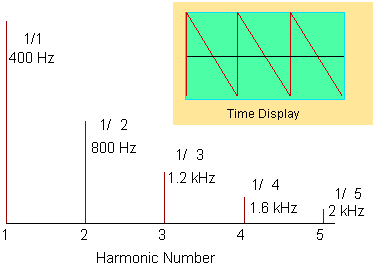
FIGURE 3.4 Sawtooth wave. Inset: time display with the x axis is used for indicating time. Below, the frequency of each harmonic, instead of time, is shown on the x axis.
If we decompose the sawtooth wave into sine wave components, you’ll
end up with a graph something like that shown in Figure 3.5:
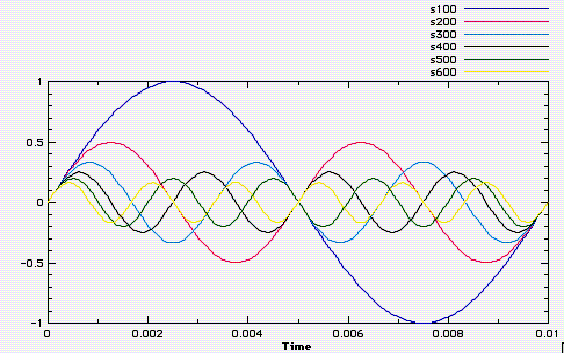
FIGURE 3.5. Sine wave decomposition of the first 6 partials of a sawtooth wave.
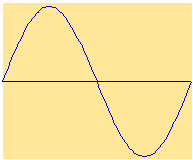
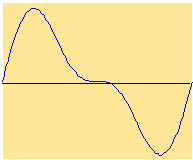
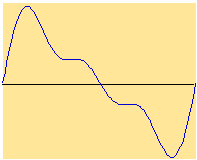
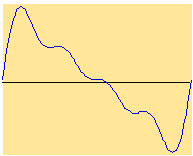
In Figure 3.6, we add each of the partials of the sawtooth wave progressively. Notice how the waveform looks more and more like the sawtooth shown in Figure 3.4, above. We would need to add together many more partials to get the perfect-looking sawtooth shape.
| 1; 1—2 partials | ||
| 1—3; 1—4 partials | ||
| 1—5; 1—6 partials |
FIGURE 3.6. Progressive
addition of the partials of a sawtooth wave. Click each waveform to hear
it.
The partials of a complex sound usually break down into both harmonic
and inharmonic frequencies. A harmonic partial
is a vibration that is related to the fundamental frequency of a vibrating
medium by ratios that are either mathematically simple (e.g., 3:2) or
complex (e.g., 3.14159:2). Most complex waveforms in nature contain many
harmonic and inharmonic frequencies, while waveforms containing only harmonically-related
tones are almost always synthetic.
Some waveforms have such a complex set of harmonics occurring at one time
that it is difficult to determine where the fundamental is. For instance, click here to hear the sound of a gong.
Notice that the low harmonic seems to fade in and then out (a kind of
amplitude modulation, as we discussed earlier).
Other waveforms might also contain what are termed noise-like
components. What people mean by this is that there's a certain amount
of non-harmonic “fuzz” occurring at many frequencies. For
instance, a cymbal has so many frequency components that it is difficult
to state that any one is that sound's actual pitch (click here to hear the cymbal). The amount of noise-like components contained
within a waveform can influence the perceived timbre of a sound significantly.
Listen to the following two sounds:
click here to hear a violin tone played
“normale” and
click here to hear a violin tone played
“col legno” .
Normally, the bow is played against the string so that its hairs activate
the natural harmonics of the violin string to a significant intensity
relative to inharmonic partials. In the second example the violin was
played col legno, where the wood part of
the bow instead of the hair is rubbed against the string. This causes
the intensity of the non-harmonic components to be relatively more intense.
Speech is comprised of both noisy and periodic vibrations. Figure 3.7
shows both noise components (sh and t) and quasi-periodic components (u)
within a speech recording of the word “shut.” Try saying the
"sh" portion of shut; it sounds like the white noise heard previously.
Now say the "u" portion. Note that it's possible to change the
pitch of "u", depending on how you say it (click here to hear u pitched at different frequencies). On the other hand,
you can't change the pitch of the "sh" portion; all you can
do is change its spectral balance by filtering the sound by differential
shaping your mouth (click here to hear sh differentially filtered).
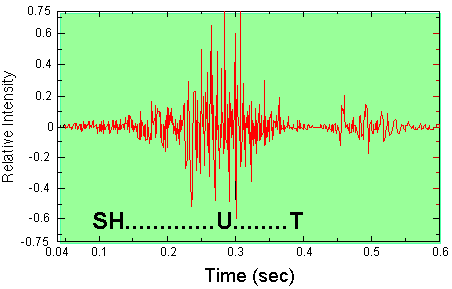
FIGURE 3.7. A waveform plot of the spoken word “shut.” A noise-like (aperiodic) portion for the “sh” sound precedes the more pitched “u” sound, while the “t” is transient.
For certain types of noise it is easiest to describe its frequency in
a statistical manner. Figure 3.8 shows a plot of white
noise, a non-periodic waveform of the type discussed earlier in
Chapter 1. White noise can be thought of as
the complete opposite of a sine wave: a sine wave has a single deterministic
frequency with a predictable intensity, while white noise has no deterministic
frequency with random amplitudes. It has a "flat" spectrum,
meaning that in contains all frequency components at equal intensity.
Another type of noise frequently used in audio applications is pink
noise. Rather than containing an equal distribution of energy across
all frequencies, pink noise contains an equal distribution of energy within
each octave.
Click here to listen to a second of white noise.
Click here to listen to a second of pink noise.
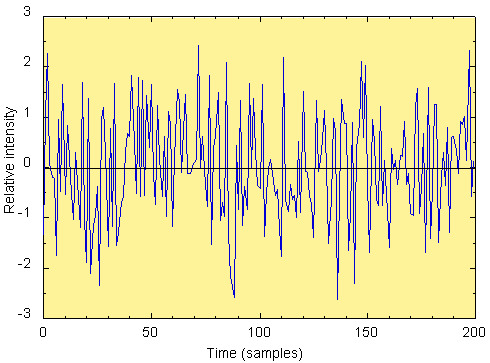
FIGURE 3.8. White noise.
Amplitude Modulation (AM) and Amplitude Envelopes
Most naturally-occurring acoustical phenomena caused by a momentary excitation
(the transference of energy from a drum stick, air, keyboard hammer, etc.
to the vibrating object) have a characteristic where the overall amplitude
builds to a maximum relatively quickly and then decays relatively slowly,
although in a manner characteristic of the particular sound source. We
refer to the overall pattern of amplitude change over time as the
amplitude envelope of a sound.
Figure 3.9 shows an “overall” amplitude envelope of all the
partials of a complex waveform, as specified on a synthesizer. Note that,
like a piano, the sound does not stop when the key is released, but takes
a brief moment to “die out.” In reality, each individual harmonic
and inharmonic component of a natural, complex sound will have its own
amplitude envelope, making the overall amplitude envelope only a rough
approximation of the sound’s temporal evolution. To experience this
yourself, click here
to hear the lowest note of a grand piano while holding down the sustain
pedal (this works best if you use a real piano). You should hear several
very different amplitude envelopes at work, emphasizing and de-emphasizing
different harmonics over time. It is the complex interaction of these
harmonics over time that gives the grand piano its unique timbral quality
and makes it very difficult to synthesize. Sound designers must work very
hard to avoid regularity in the short term or long term envelopes of each
of a synthesized sound’s harmonics as well as its overall amplitude
envelope, if a “natural” as opposed to “synthetic”
character is desired.
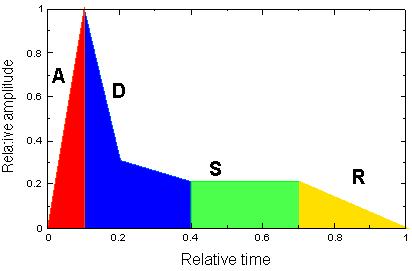
FIGURE 3.9. The ADSR (Attack-Decay-Sustain-Release) amplitude envelope, a simplified way of describing the overall intensity of a complex sound over time. It is commonly used on sound synthesizers and samplers to describe what occurs with a single keystroke, or digital “note on” command. Specifically, the ADS portion of the sound is what happens when a key is pushed down (note on), and the R is what occurs when the key is let up (note off).
Click here to listen to the sound of a violin being plucked with the fingers (a pizzicato note). The waveform shown in Figure 3.10. Notice the amplitude envelope has greatest intensity when the string is initially plucked, how the intensity is reduced considerably after this point, and then how the sound dies away steadily as the intensity of the vibration of the string (and its resonance within the body o the violin) diminishes. Note also how the waveform looks noisy at first, and then how periodic frequency can be detected later in time.

FIGURE 3.10. A
waveform of a plucked violin string, along with its amplitude envelope.

FIGURE 3.11. The amplitude envelope of a zipper being open.
Figure 3.11 shows the amplitude envelope of a zipper being pulled open.
Click here to listen to its sound. Note
the envelope is loudest when pulling harder on the zipper, and then dies
down quickly once the zipper is going smoothly. The amplitude envelope
is irregular since the resistance of pulling open a zipper will also be
irregular.
The importance of the attack portion of the amplitude envelope to the
perception of timbre can be demonstrated in the following examples. All
three are from the same sound source: a natural harmonic played on an
acoustic guitar.
Click here to listen to the unaltered sound.
Click here to listen to only the attack portion of the harmonic. This is where the “bite” of the sound is produced in the excitation of the string, and is characteristic of a guitar attack.
Click here to listen to only the decay and sustain portion of the harmonic. Amazingly, the sound has lost any characteristic of the guitar; it has the rich content of partials and the decay of the harmonic; but without the attack, the sound is almost like a French Horn.
The amplitude envelope is a form of amplitude modulation.
If you multiply the output of a digital device by a time-varying function,
that would be a form of amplitude modulation. Similarly if you wiggle
the volume control on an amplifier back and forth, you've got hand-operated
amplitude modulation. Amplitude modulation means “varying intensity
over time.” Figure 3.13 shows the amplitude modulation of a sine
wave by two cycles of a triangle wave, shown below in Figure 3.12. The
triangle wave oscillates at a much slower frequency than the sine wave;
while the sine wave is within the audio frequency range, the triangle
wave used here has a frequency of about 0.5 Hz, well below the lowest
frequency of human hearing. We hear the effect of the triangle
wave, demonstrated by the up-and-down ramping of the sine wave's
amplitude.
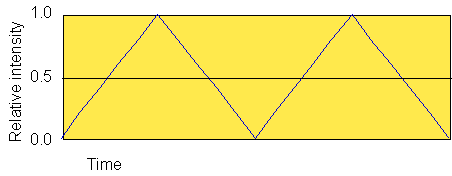
FIGURE 3.12. The
triangle wave used for amplitude modulation in Figure 3.13.
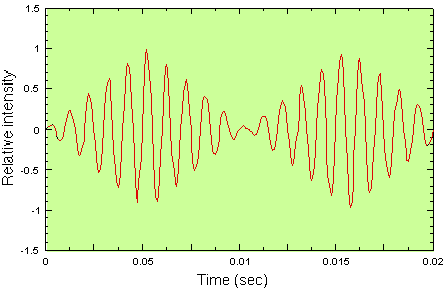
FIGURE 3.13. The
amplitude modulation of a 100 Hz sine wave by a 10 Hz triangle wave as
shown in Figure 3.12 results in a constant, synthetic amplitude envelope.
Frequency Modulation
There are two types of FM that concern us. The first is low-frequency
FM, used to create vibrato (pitch modulation). The second is high-frequency
FM used for synthesis. Figure 3.14 below shows a sine wave with decreasing
and then increasing low-frequency modulation by a sine wave.
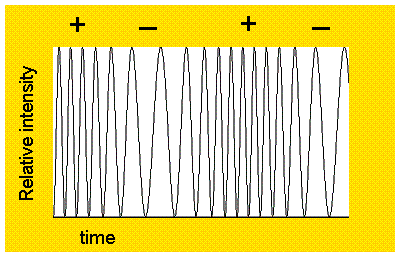
FIGURE 3.14. Frequency modulation. The plus signs indicate when the modulation is maximal and the minus signs when the modulation is minimal, corresponding to the peaks of the modulating sine wave.
Low-frequency modulation is usually termed vibrato. It is a variation in the frequency of a pitch above and below a fundamental pitch, usually, no more than within a musical half-step. It is a feature that most instrumentalists include in their music, if it is possible to create the effect. For instance, a singer almost always uses vibrato. There are different styles of vibrato; a “wide” vibrato can sound “schmaltzy” or overly romantic, while music of the baroque era (from 1600—1750; e.g., J. S. Bach) was performed in its day with very little vibrato. Every performer uses vibrato a little bit differently, which contributes to the unique character of an individual performance.
For instance, click here to hear a violin tone played without vibrato (indicated as “non vibrato” in a music score); then
click hereto hear a violin tone played as we usually expect to hear it. The second example has a moderate amount of vibrato, and either no special indication or the word “normale” would be indicated in a musical score. It is interesting that in spite of the variation in frequency, we associate pitch with the center frequency of the modulation.
Figures 3.15—16 show the relationship between a modulating wave
(the modulator) and the wave affected by it (the carrier),
for both frequency and amplitude modulation. Two parameters of the modulating
wave are relevant: the frequency of the modulating waveform, and the intensity
of the waveform (sometimes referred to as modulation depth). In Figure
3.15, the modulation is applied to the frequency of the carrier, while
in Figure 3.16, the modulation is applied to the intensity. Figures 3.15-3.16
use a sine wave carrier and modulator.
The two types of modulation cause quite different effects at low and medium
frequencies. When the modulator goes from sub-audio to audio frequencies
(the high frequency setting), spectral sidebands are produced; we hear
a different timbre but not the modulator directly. The high-frequency
modulation in Figure 3.15 produces relatively fewer non-harmonic partials
because the modulator and carrier have simple frequency ratios. Non-harmonic
frequency modulation causes a richer blend of non-harmonic partials (click here). One can choose any sort of waveform to act as a modulator as
well, for instance, click here to listen
to randomly-chosen numbers (noise) as the frequency modulator. This yields
a “machine computation” sound effect sometimes used in film.
FIGURE 3.15. The
effect of frequency modulation (FM) of a carrier oscillator.
F is the frequency control input of the oscillator; G is the gain of the
oscillator.
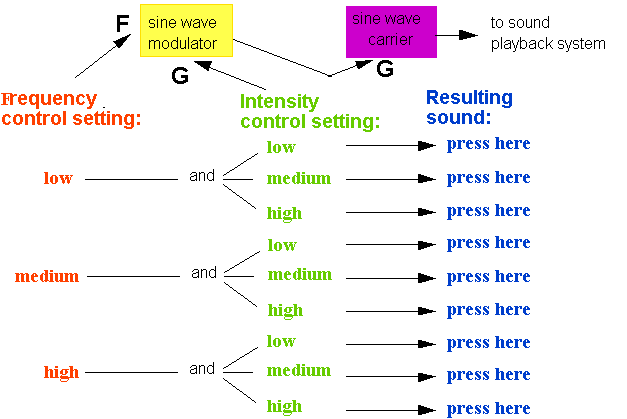
FIGURE 3.16. The effect of amplitude modulation (AM) of a carrier oscillator. F is the frequency control input of the oscillator; G is the gain of the oscillator.
Waveform Phase
In addition to frequency and intensity, the phase of a waveform is a fundamental
concept for describing sound. A waveform's phase has to do with its “starting
time” relative to another waveform. It also refers to the relative
onset of a group of partials within a complex sound.
For example, consider a loudspeaker with a "woofer" for low
frequencies and a "tweeter" for high frequencies. Loudspeakers
often use a "crossover" filter to split a signal into two frequency
bands- high and low. Now consider what happens when a square wave is played
though the system. If we move the tweeter closer or farther away relative
to the woofer, the high frequencies will have a different phase relationship
to the low frequencies.
Figure 3.17 shows two identical sine waves in terms of frequency and intensity,
but one waveform is offset in its phase relative to the other. Waveform
B is delayed relative to waveform A by a period of time equivalent to
a quarter period (90 degrees) of its wavelength, which is 0.001 seconds,
or 1 millisecond (abbreviated msec).

FIGURE 3.17. Two 250-Hz sine waves, A and B. Wave B is delayed by a quarter of a cycle (90��), i.e., by .001 seconds (or 1 millisecond).
When listening to a periodic waveform, it’s impossible to distinguish between a version with all of the harmonics “in-phase” and one with some of the harmonics completely “out-of-phase.” Figure 3.18 shows two waveforms consisting of the first six harmonics of a triangle wave. The blue and red waveforms are identical except that every other harmonic is out-of-phase in
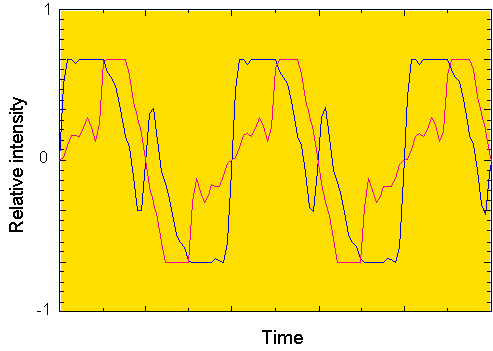
FIGURE 3.18. Triangle wave with in-phase (blue) and out-of-phase (red) harmonics.
the red version. Although the two waveforms in Figure 3.18 look different,
they sound identical: click hereto listen
to the in-phase version, and click here
to listen to the out-of phase version. This is a simple proof that high-end
audio system guaranteed to have “linear phase” are more smoke
than fire. The absolute phase of individual
harmonic components is inaudible to the ear.
On the other hand, relative phase is a very
significant issue for an audio system. Phase becomes an issue in multimedia
audio when mixing waveforms electronically with an audio mixer, or when
mixing waveforms in the air as occurs with two-channel loudspeaker playback.
In these cases we have a situation where either constructive
or destructive interference can occur. Consider
the addition of two in-phase sine waves together. This is the same as
multiplying the waveform by 2; each instantaneous value of the waveform
sums constructively such that the resulting waveform has a greater intensity.
But if you sum each instantaneous value of a sine wave with another that
is 180 degrees out-of-phase, the result is 0 intensity (see Figure 3.19).
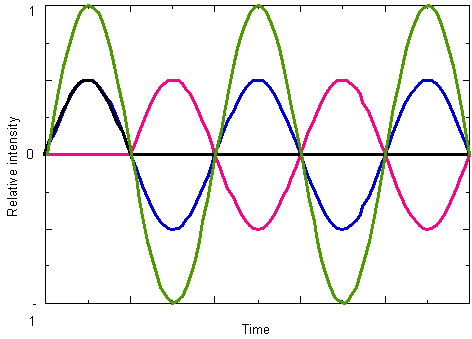
FIGURE 3.19. Constructive and destructive interference. The blue waveform is an in-phase sine wave. By adding this waveform to an in-phase copy of itself, the green waveform with twice the intensity would result (constructive interference). But if the blue waveform were added to a 180?degree, out-of-phase copy of itself (the red waveform), destructive interference results (represented by the black waveform with 0 intensity).
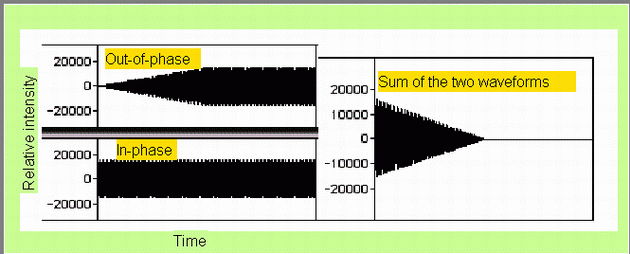
FIGURE 3.20 See text below. You can also click on each part of the Figure to listen to the waveform.
The following example shows an extreme case of how destructive interference
occurs when signals are out-of-phase. Click here to listen to the lower waveform on the left of Figure 3.20. This
is an in-phase triangle wave. Click here
to listen to the upper waveform at the left of Figure 3.20. This is the
same triangle wave, 180 degrees out-of-phase, with a steadily increasing
amplitude envelope; eventually it reaches the same intensity as the lower
waveform. At the right side of Figure 3.20 is the result of adding the
two waveforms on the left; click here
to listen to the result. You can also click on each of the waveforms in
the figure as well. In this example, the destructive interference increases
as a function of the intensity of the out-of-phase waveform.
Destructive interference can also occur when mixing waveforms in the air,
for instance, from two stereo loudspeakers. Listen carefully to the next
two examples with your head between the stereo loudspeakers that you’re
currently using with this website.

Click here to listen to an in-phase
triangle wave; and
Click here to listen to out-of-phase triangle
wave.
The in-phase triangle wave should create a stable image localized in-between
the speakers; the out-of-phase version should sound split between two
locations in the speakers, and sound less loud in one speaker. If the
opposite occurs, your speakers are wired out-of-phase; reverse the leads
on one of your speakers, if you know how. In Chapter
8 there are additional tests for determining loudspeaker phase and
details on how to reverse the phase of your loudspeakers.
To summarize, the relative phase of harmonic components within a single
waveform is inaudible, but the relative phase of two waveforms mixed in
either air or electronically can result in significant changes in the
audio communication chain, and therefore must be taken into account.
