CHAPTER 9.
CUTTING EDGE TECHNOLOGIES: 3D SOUND AND AURALIZATION
3D Audio
"3D audio" is a generic term that describes the promised result
of many systems that have only recently made the transition from
the laboratory to the commercial audio world. Many other terms have
been used both commercially and technically to describe the technique,
but all are related in their promise of a spatially enhanced auditory
display. Much in the same way that stereophonic and quadrophonic signal
processing devices were introduced as improvements over their predecessors,
3D audio technology can be considered the latest innovation for
both mixing consoles and reverberation devices.
Nominally, we would describe a sound in terms of three perceptual categories: pitch, tone color, and loudness; or in terms of their equivalent physical descriptors, frequency, spectral content, and intensity. However, spatial location is also an important perceptual quality. It's the ability to manipulate spatial location that defines the innovative "3D" aspect of sound in cutting-edge audio technology.
How do we hear sounds in space? For a long time, researchers held that interaural intensity and interaural time differences were the cues used for auditory localization. For instance, if you snap your fingers to the right of your head, the wavefront’s intensity will be louder at the right ear than at the left ear. Higher frequencies are shadowed from the opposite ear by the head; but frequencies below about 1.5 kHz diffract around to the opposite ear. The overall difference in intensity levels at the two ears are interpreted as changes in the sound source position from the perspective of the listener. This is the same cue used by the pan control on a mixer; by adjusting the output level between left and right speakers, it is possible to manipulate the perceived spatial location of the virtual image. Note that when the signal level is equal from both speakers and we're listening from a position between them, the signal appears at a virtual position between the speakers, rather than as two sounds in either speaker.
Another cue for spatial hearing besides the interaural intensity difference is the interaural time difference. The wavefront reaches the right ear before the left ear in time, since the path length to that ear is shorter, and sound travels at a constant rate through air. These differential arrival times are also evaluated as a cue to the change of a sound source’s position. Wearing headphones and using a digital delay applied to the left channel, one can make a soundfile of a finger snap travel from the center of the head to the right side, by increasing the inter-channel delay from 0 to about 1 millisecond. This time delay cue is most effective for lower frequencies below 1.5 kHz.
Effects produced like this over headphones are not really localized as much as they are lateralized. This refers to spatial illusions that are heard inside or at the edge of the head, but never seem at a distant point outside the head, or externalized. Why aren't these sounds externalized if we're activating important spatial cues of interaural time and intensity differences? There are three reasons. One is the lack of proper feedback from head motion cues. When we hear a sound we wish to localize, we move our heads in order minimize the interaural differences, using our heads as a sort of pointer. This makes sense because we usually use our aural and visual senses together, and we'd want to look at the thing we've localized via sound (probably to decide whether to pounce or run, "fight or flight" from an evolutionary perspective). With headphone listening, head movement causes no change in spatial auditory perspective—it remains invariant, no matter where your head is. Head movement in relationship to stereo loudspeakers outside the head is even worse because intensity and time differences change with no relationship to the intended virtual imagery.
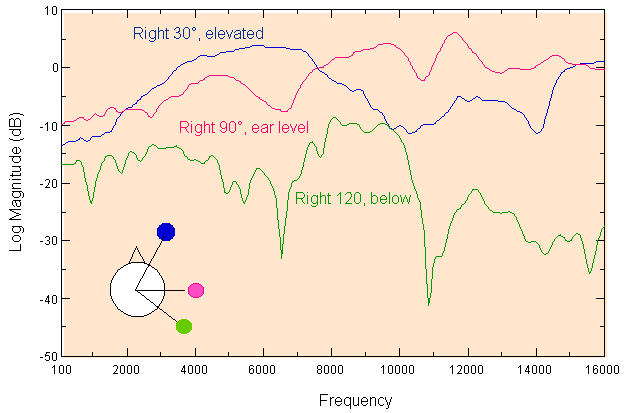
Another reason for imperfect localization with only intensity and time differences has to do with the spectral modification caused by the outer ears (the pinnae). This spectral modification can be thought of as equivalent to what a graphic equalizer does—emphasizing some frequency regions while attenuating others. The modification at one ear for a given position is technically referred to as the head-related transfer function (HRTF), sometimes a.k.a. anatomical tranfer function (ATF). This spectral modification has been recognized as an important cue to spatial hearing, especially for front-back or up-down cues.
Consider a sound source at right 60 degrees azimuth,
0 degrees elevation, along with another at the same elevation but at a “mirror
image” position of right 120 degrees azimuth. These two sound sources
have roughly the same overall interaural time and intensity differences,
as shown in Figure 9.1. But if you listen and compare, you'll hear the
rearward sound as having a relatively “duller” timbre. In
fact, for a given broadband sound source, each elevation and azimuth
position relative to the listener contains a unique set of HRTF-based
spectral modifications that act as a acoustic “thumbprint,”
as shown in Figure 9.2. This is explained by the complex construction
of the outer ears, which impose a set of minute delays that collectively
translate into a particular two-ear (binaural)
HRTF for each sound source position.
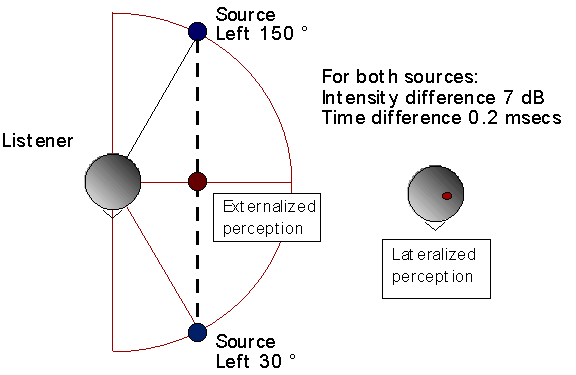
FIGURE 9.1. Sound source positions (blue circles) can have ambiguous percepts that are either externalized (left red circle) or lateralized within the head (right red circle).
FIGURE 9.2. HRTF frequency modification for three positions. Inset: overhead view.
The final reason has to do with reverberation. Research implies that a virtual sound source is more effectively externalized over headphones when reverberation is present in the stimuli. In fact, there have been efforts over the last two decades to apply the same 3D sound techniques to reflected as well as direct sound, using ray tracing models of enclosures. This is termed auralization in acoustical design applications, and spatial reverberation in recording engineering applications.
In summary, there are three important cues for synthesizing a sound source to a given virtual position outside a headphone listener: (1) overall interaural level differences; (2) overall interaural time differences; and (3) spectral changes caused by the HRTF. Finally, it's important to recognize that spatial hearing occurs within an environmental context, which is cued via unique patterns of reverberation.
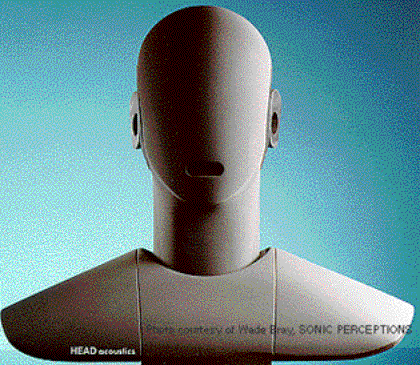
Spatial HRTF effects can be captured for a fixed listening position by use of a dummy head recording (see Figure 9.3). These mannequin heads contain a stereo microphone pair located in a position equivalent to the entrance of the human ear canal. One can obtain a spatial recording with such a device, but it is then difficult to move a particular virtual image to an arbitrary spatial position during post-production. What if we wanted 3D control over spatial imagery, instead of a pan control?
FIGURE 9.3. The HEAD Acoustics Model HMS II dummy head recording device. The outer ears were designed according to a "structural averaging" of HRTFs; note the inclusion of the upper torso.
This limitation is overcome through the use of 3D sound DSPs, both onboard and outboard. Without going into details (see the author’s book 3D Sound for Virtual Reality and Multimedia for that!), it is sufficient to know that one can take HRTF measurements at various positions, which are then represented as digital filter parameters. These parameters can then be selectively recalled into 3D sound DSP units, depending on what position one wishes to simulate. By filtering an audio file or streamed or live source or live sound with the HRTF filter pairs (one for each ear), one can simulate any spatial position for a listener. Several research and development efforts are underway worldwide where HRTF measurements are collected, and subsequently utilized for digital filtering; 3D sound processing is part of several software packages. Although many of these efforts are commercial, some research programs also focus on perception, i.e. how much error is involved in the simulation.
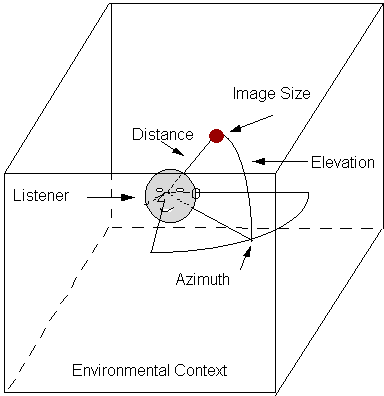
Figure 9.4 summarizes the aspects of spatial hearing that can be potentially manipulated by a 3D audio system, including azimuth, elevation, and distance of the virtual sound source. Simulation of the environmental context is another aspect of virtual acoustic simulation; and finally, it would be ideal if we could arbitrarily control the virtual image’s size and extent. In reality, all of these factors interact, making absolute control over 3D audio imagery technically challenging.
FIGURE 9.4. A
taxonomy of spatial hearing.
3D Audio Listening Examples
Click here to go to a movie featuring interactive and
non-interactive demos of 3D sound. Wear headphones to
get the intended spatial effect! Then compare this to loudspeaker listening.
(NOTE–you’ll be launching a “movie within a movie”;
after you’ve heard the last demo, you’ll be returned back
to this location).
Loudspeaker Playback of 3D Sound
Why doesn’t the imagery in the 3D sound demo hold up as well over
loudspeaker playback as it does over headphones? This is because 3D sound
effects truly depend on being able to predict the spectral filtering occurring
at each ear. We already mentioned the problem of predicting interaural
intensity and time differences from loudspeakers when a person moves their
head. But another problem for even the listener who keeps their head absolutely
still in the sweet spot (the “ideal”
listening location between two stereo loudspeakers) is that each loudspeaker
is heard by both ears; this cross-talk affects
the spectral balance significantly.
Cross-talk cancellation compensates for this
by supplying a 180 degree out of phase signal from the left speaker to
the right speaker, delayed by the time of arrival to the ear; and vice
versa. However, for this to work over the entire audible range, you need
to know exactly where the head and speakers are, and even the effect of
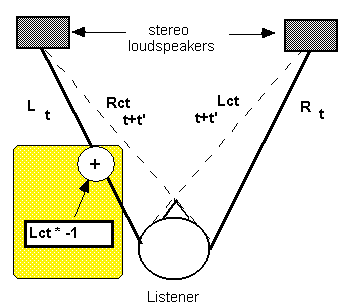
the person’s head on the cross-talk signal. Figure 9.5 illustrates a cross-talk cancellation system.
FIGURE 9.5. Cross-talk
cancellation theory. Consider a symmetrically placed listener and two
loudspeakers. The cross-talk signal paths describe how the left speaker
will be heard at the right ear by way of path Rct, and the right speaker
at the left ear via path Lct. The direct signals will have an overall
time delay t and the cross-talk signals will have an overall time delay
t + t’. Using cross-talk cancellation techniques, one can eliminate
the Lct path by mixing a 180-degree phase-inverted and t’-delayed
version of the Lct signal into the L signal, and similarly for Rct.
Auralization
Auralization involves the combination of room modeling
programs and 3D sound-processing methods to simulate the reverberant
characteristics of a real or modeled room acoustically. “Auralization
is the process of rendering audible, by physical or mathematical modeling,
the sound field of a source in a space, in such a way as to simulate the
binaural listening experience at a given position in a modeled space”.
(See Kleiner, Dalenbäck, and Svensson: “Auralization-an overview,”
in the Journal of the Audio Engineering Society (1993:
vol. 41, pp. 861-875), for an excellent in-depth overview
of the topic.)
Auralization software/hardware packages advance the use of acoustical computer-aided design (CAD) software and, in particular, sound system design software packages. Acoustical consultants and their clients can listen to the effect of a modification to a room or sound system design and compare different solutions virtually.
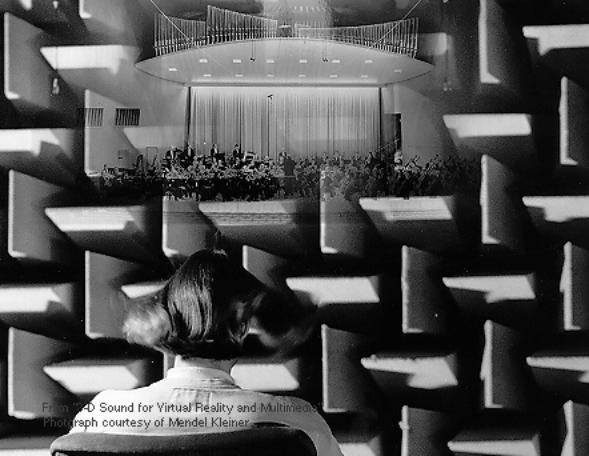
FIGURE 9.6. A listener in an anechoic chamber experiencing a virtual concert hall, created by applying auralization techniques.
The potential acceptance of auralization in the field of acoustical consulting is great because it represents a form of (acoustic) virtual reality that can be attained relatively inexpensively. Although computationally intensive, the power and speed of real-time filtering hardware for auralization simulation is continuously improving due to the ongoing development of improved DSP techniques, both on-board and within external devices. Compared to traditional methods using blueprints and scale models, auralization software-hardware systems allow physical and perceptual parameters of a room model to be calculated and then parametrically varied. The variation in acoustic parameters can then be verified by listening, within the limits of the accuracy of the reverberation modeling and 3D sound presentation techniques used.
Prior to the ubiquitousness of the desktop computer, the analysis of acoustical spaces mostly involved architectural blueprint drawings and/or scale models of the acoustic space to be built. Relatively unchanged is the technique of making an analogy between light rays and sound paths to determine early reflection temporal patterns, by drawing lines between a sound source, a reflective surface, and a listener location. This “geometrical approach” to eliminating noticeable echoes was born around the beginning of the twentieth century, concurrent with Wallace Sabine’s mathematical approach to determining reverberation time from an enclosure’s volume. These two developments flag the birth of modern architectural acoustics, the science of predicting and correcting the effects of an enclosure on sound quality through control of reverberation.
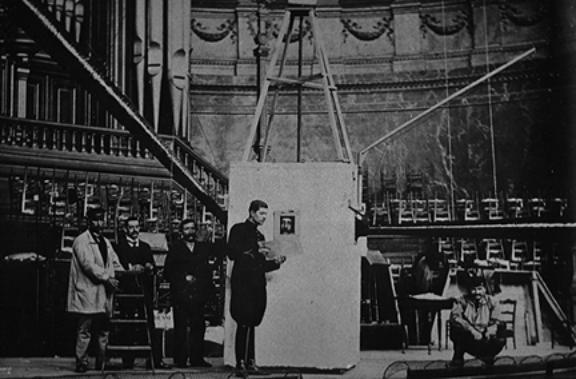
Figure 9.7 shows an early attempt to correct concert hall acoustics by Gustave Lyon, director of the French musical instrument manufacturer Pleyel. He stands in uniform next to an assistant inside of a sound absorbing box (called the Cage aphone). This box contains a sort of funnel at the top that can be precisely aimed at various parts of the concert hall. The hall was caused to resonate at various locations by a wood clapper device; by listening to the reverberation with the narrow audio focus made possible with the funnel, one could pinpoint the exact location of reflecting surfaces that casued distinct echoes. Following this sort of analysis, absorptive material could be strategically placed so that the early reflections hitting these surfaces could be absorbed, and thereby attenuated by the time they reached the listener.
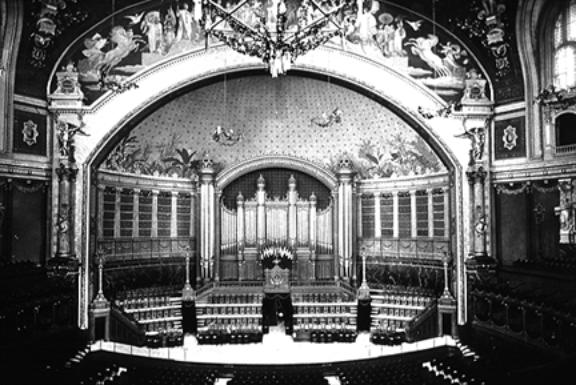
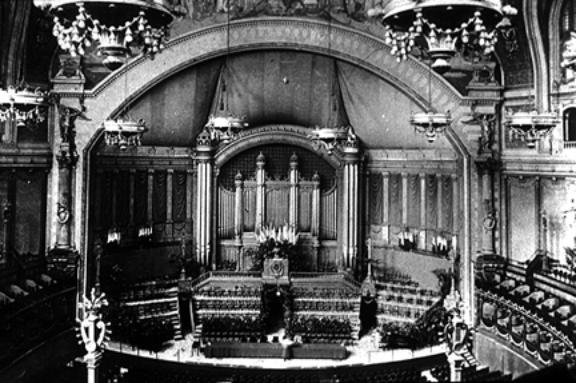
Figure 9.8 and Figure 9.9 show examples of early “before” and “after” treatment of disturbing echoes in the Concert Hall of the Palais du Trocadéro (built in 1878 for the Universal Exhibition), by Gustave Lyon. Note the covering of absorptive felt in the cupola in Figure 9.8 above the organ pipes.
FIGURE 9.7. Gustave Lyon and an assistant analyzing the location of echoes in a special soundproof box (the Cage aphone); the sound funneling device for aiming towards various wall surfaces extends outwards from the left side.
FIGURE 9.8. Concert Hall of the Palais du Trocadéro before acoustic correction.
FIGURE 9.9. Concert Hall of the Palais du Trocadéro after acoustic correction. Note the absorptive material that has been placed in the cupola above the organ pipes.
While eliminating echoes was one good reason to perform an acoustic analysis of early reflections, it took decades for architectural acoustics to discover that the spatial time-intensity pattern of early reflections is also important. In particular, it is now possible to predict how the spatial incidence of reflections to a listener affects perceived quality of a room. In the early twentieth century, architectural acoustics shared roughly the same maxim as the classic Greek theater—to reflect as much sound intensity as possible towards the audience’s direction.
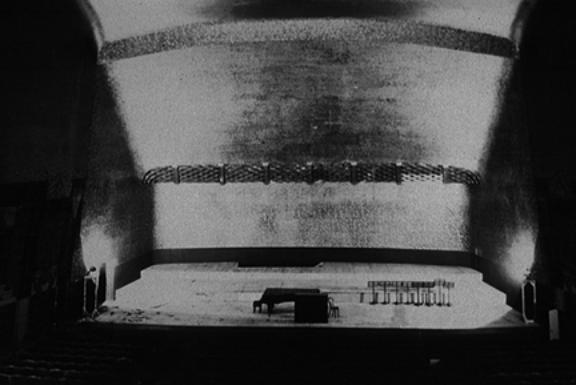
Figure 9.10 shows the Salle Pleyel in Paris, designed in the late 1920s by Gustave Lyon, based on his research in improving the Palais du Trocadéro hall seen in Figures 9.8–9.9. It is designed with a curving overhang over the stage, which certainly propelled reflected energy outwards, in contrast to the cupola seen previously in Figure 9.7. But note that this design does nothing to propel reflections from lateral directions towards a listener. It is now known that having early reflections arrive from side directions is preferable to reflections that arrive first from above or in front. Within certain limits, the more that early reflections are binaurally differentiated—i.e., in “stereo”—the more preferred are the acoustics. Incidentally, this is a feature imitated by some surround sound processors.
FIGURE 9.10. The Salle Pleyel. Note that the reflective shell behind the stage focuses early reflections forwards but not sideways.
An auralization system consists of software that inputs the parameters of a room design, and outputs physical, perceptual and simulation data. The simulation data consists of filter parameters that are either piped to a 3D audio hardware device for DSP simulation, or are computed on the host computer itself. An anechoic sound (recorded without reflections) is then input through these filters for virtual simulation of the direct and reverberant sound field. The software calculates the intensity, time delay and spatial incidence of reflected sound from source to surface to listener. Each surface, such as the walls, curtains, people and seats in a concert hall, will have a specific filtering effect on the reflection. Early reflections are calculated individually; a statistical approach is often used to model the dense number of reflections present in late reverberation.
One begins in an acoustical CAD system by representing a particular space through a room model. This process is a type of transliteration, from an architect’s blueprint to a computer graphic. A series of planar regions must be entered to the software that represent walls, doors, floors, ceilings, and other features of the environmental context. By selecting from a menu, it is usually possible to specify one of several architectural materials for each plane, such as plaster, wood, or acoustical tiling. In reality, the frequency-dependent magnitude and phase transfer function of a surface made of a given material will vary according to the size of the surface and the angle of incidence of the waveform. In most auralization programs, the magnitude transfer function is simplified for a given angle of incidence, due to computational complexity.
Once the software has been used to specify the details of a modeled room, sound sources may be placed in the model. After the room and speaker parameters have been joined within a modeled environment, details about the listeners can then be indicated, such as their number, head-direction and position. Prepared with a completed source-environmental context-listener model, a synthetic room impulse response can be obtained from the acoustical CAD program. A specific timing, amplitude, and direction for the direct sound and early reflections is obtained, based on the ray tracing or image model techniques described ahead. Usually, the early reflection response is calculated up to around 100–300 msec. The calculation of the late reverberation field usually requires some form of approximation due to computational complexity. A room modeling program becomes an auralization program when the room impulse response is spatialized in relationship to a virtual listener.
Figure 9.11 shows the basic process involved in a computer-based auralization system intended for headphone audition. The model also will include details about relative orientation and dispersion characteristics of the sound source, information on transfer functions of the room’s surfaces, and data specifying the listener’s location, orientation, and HRTFs.
FIGURE 9.11. The basic components of the signal processing used in an auralization system.
CATT-Acoustic is an example of a “cutting edge” approach to the calculation of a virtual environment through the use of integrated acoustical CAD and auralization techniques. In the following figures, the variety and complexity of analytical information used by the acoustical consultant and the architect are shown. At the end of these examples, you’ll be able to listen to—or auralize—a modeled acoustical space, from different locations.
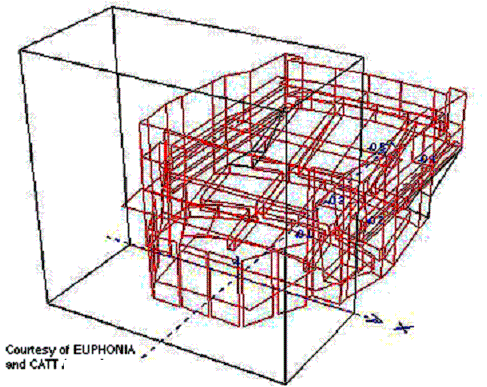
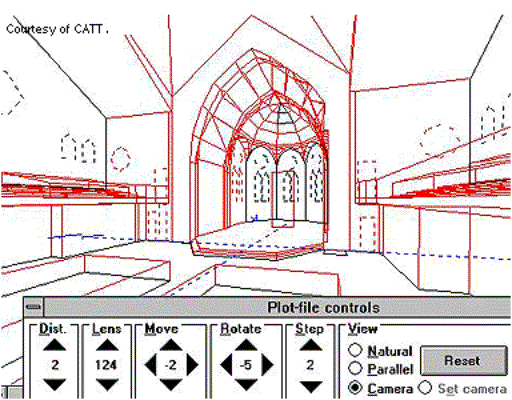
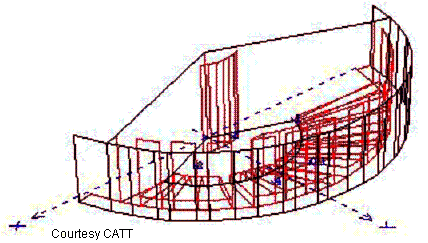
Figure 9.12 shows a perspective view of a concert hall. The dashed blue lines intersect on the location of a modeled sound source, while the numbers refer to five seating locations to be analyzed. Each surface is modeled according to its particular frequency-dependent absorption and diffusion characteristics. Figure 9.13 shows how the software allows viewing an enclosure from different perspectives, via a GUI (graphical user interface) (this example shows the interior of a church). One can navigate through and around an enclosure, in a manner similar to exploration within a virtual world.
FIGURE 9.12. Perspective view of a hall: the Espace des Arts (Chalon-sur-Saône, France: A. Moatti, architect and theater consultant; B. Suner, acoustical consultant).
FIGURE 9.13. A view inside of a church, with controls for changing view perspective.
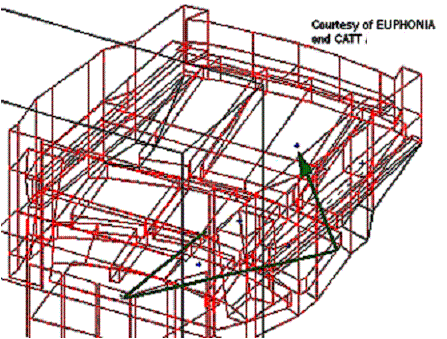
Once all of the parameters are determined for an enclosure such as shown in Figures 9.12–13, it is then possible to execute an acoustical analysis of the early reflections and dense reverberation pattern for the indicated seating positions, and derive a binaural impulse response for virtual acoustic modeling. Figure 9.14 shows the ray trace of an individual early reflection, in its path from the source to the listener.
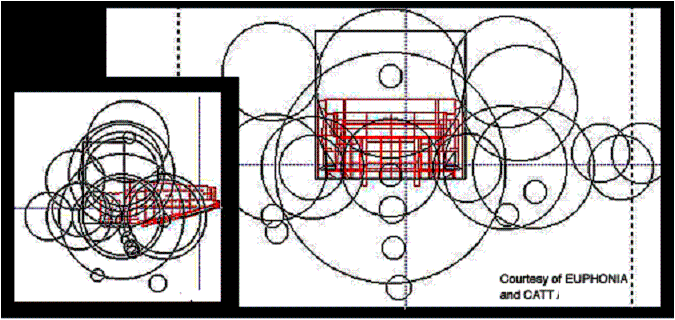
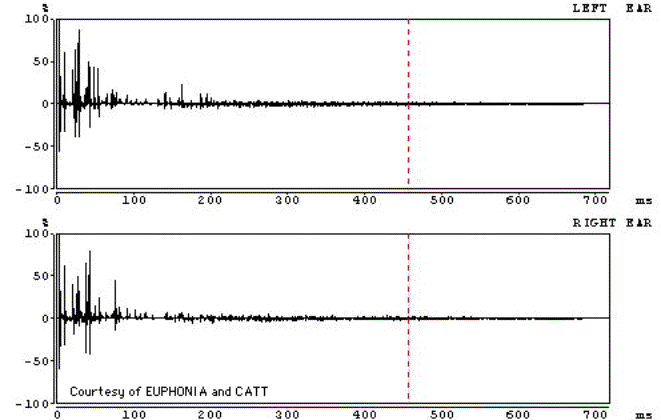
Figure 9.15 shows a section view of the hall that can be thought of as a “spatial calculation” of the early reflections, as determined by image model ray tracing. The size of each circle corresponds to the reflection intensity, the distance corresponds to time delay, and the location corresponds to the relative angle of incidence to the listener. Figure 9.16 shows the resulting binaural impulse response; the large peaks correspond to strong reflections within the enclosure.
FIGURE 9.14. Ray trace of an early reflection (close-up of Figure 9.12).
FIGURE 9.15. Spatial calculation of the intensity of virtual images. Left: side view; right: forward view. The size of the circle is the intensity of the refelction; the distance from the hall is the time delay; and the location is relative to a listener seated in the hall.
FIGURE 9.16. Binaural impulse response.
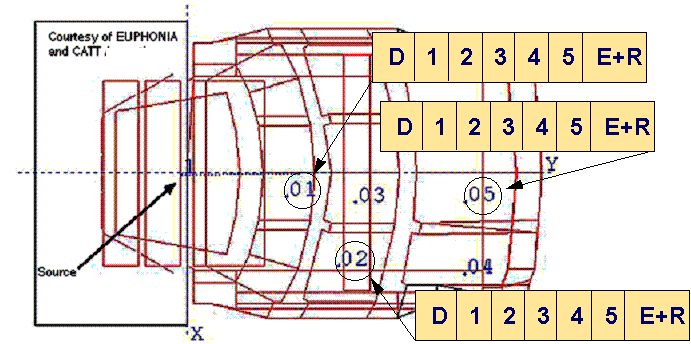
Figure 9.17, an overhead view of the hall shown in Figure 9.12, allows one to auralize the environment as if seated at three different positions (labeled .01, .02, and .05). By clicking your mouse on the following items, you can hear the increase in the complexity of the acoustical simulation. The number of early reflections modeled ranges between:
![]() none (labeled “D”
in Figure 9.18);
none (labeled “D”
in Figure 9.18);
![]() first–fifth
order (labeled 1–5 in the figure); and
first–fifth
order (labeled 1–5 in the figure); and
![]() a complete simulation
with late reverberation (labeled “E+R”).
a complete simulation
with late reverberation (labeled “E+R”).
The examples demonstrate how a sound field consists of an increasingly
complex set of reflections, and how each can have an important influence
on the resulting reverberation. However, note that both late reverberation
and early reflections are important to forming a recognizable virtual
acoustic image.
click here to listen the original sound.
FIGURE 9.17. Overhead
plan of hall shown in Figure 9.12. Click on D to hear
the direct sound; 1, 2, 3, 4, 5 to hear increasing orders
of early reflections added to the simulation;
Finally, it was pointed out earlier in this chapter that head movement
can contribute substantially to the realism of a virtual acoustic simulation.
In the following examples, we demonstrate how the halls just heard sound
with the head movement of another person. To be truly a virtual experience,
the virtual acoustic image would need to change in relationship to one's
own head movement, but this is beyond the technology of the current
medium (this web site. Nevertheless, you’ll be surprised at how
even more realistic these examples are; they simulate the head movement
of one who is “exploring” virtual acoustic space. These examples
were synthesized using CATT-Acoustic with the “HeadScape”
software and “Huron” hardware system manufactured by Lake
DSP. Figure 9.18 shows the hall in which these simualatins are situated.
FIGURE 9.18. Simple hall model used for the head movement examples below.
Click here for the first head movement
example; and
click here for the second head movement
example.
