CHAPTER
2.
AUDIO BASICS II: INTENSITY AND LOUDNESS
We have shown how the frequency of a waveform is measured in terms of
the variation in pressure over a unit of time of air molecules; i.e.,
the number of waveform periods (cycles) that occur over one second. What
determines the literal intensity of the waveform
and its perceived loudness is the degree
of sound pressure. Our hearing system is designed to discriminate between
both different frequencies and intensities of sound.A sound wave carries
energy as it propagates; the power of a waveform for a given area is the
intensity of the waveform (mathematically, watts/meter2). Loudness is
defined as the perceived magnitude of intensity; as with pitch and frequency,
there's a “human element” of interpretation that doesn't follow
physical measurements.
Graphically, the intensity of a periodic waveform can be observed by noting the height, or peak value of a periodic waveform on the y axis. Figure 2.1 shows two cycles of a 1 kHz sine wave: the blue waveform peaks at an intensity of 1, and has 2 times the intensity of the red waveform, which peaks at 0.5. The numbering scale used on the y axis graphs the maximum possible range of possible intensities for each sample within the range -1 to 1.
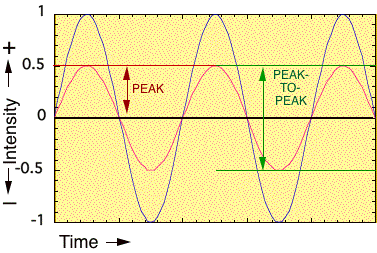
FIGURE 2.1. Peak and Peak-to-peak intensity measurement of a periodic wave.
This is one way to represent the maximum dynamic range of a system; intermediate values are represented in the graph (but not internally on the computer) as —floating-point numbers— a number with a value to the left and to the right of the decimal point. On a computer, intensity can be described in arbitrary units (e.g., ±1) for computational purposes, since we are measuring a relative level of a sound sample. We can also use what is termed the signed integer sample value, with numbers ranging from -32767 to 32767. These represent the numbers used internally with 16-bit quantization (see discussion in Chapter 6). Most waveform editing software offer a choice between sample values or % of dynamic range used.
We can describe intensity in terms of the peak-to-peak value of the waveform according to a scale (green lines in Figure 2.1). The intensity of a periodic waveform can be easily observed in this way, but non-periodic waves such as those in Figure 2.2 are more difficult to describe in this way. In such cases one can measure intensity by obtaining the root mean square (rms) value. This is obtained by squaring all of the instantaneous values of a waveform over a given period, taking the average of that value, and then obtaining the square root of that number. For instance, the peak value of the blue waveform in Figure 2.1 is 1, but the rms value would be .707. In Figure 2.2, the rms value, in terms of the relative intensity -1 to 1 and in terms of relative dB is shown.
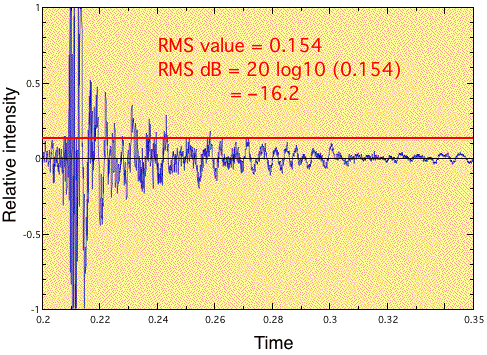
FIGURE 2.2. The rms value is obtained of a given period of a waveform by squaring all of its instantaneous values of a waveform; taking the average of that value; and then obtaining the square root of that number. Using the 20log10 formula, we can obtain the rms dB value.
In Figure 2.2, we see the conversion of the rms level to a value expressed in relative dB. It is convenient to express the maximum dynamic range of a digital system with floating-point numbers in the interval -1 to +1. Using the following equation for relative dB gives a scale where maximum intensity is 0, and lesser values have negative numbers, much like on a tape recorder VU meter:
relative dB rms = 20 log10 (rms value)
Given the rms intensity value of 0.154 in Figure 2.2, we obtain —16.2 dB rms. Multiplication of a waveform by 0.5 results in a reduction of 6 dB (for instance, a 0 dB rms waveform multiplied by 0.5 becomes a —6dB rms waveform). This type of relative dB measurement is typically used in computer audio software “change gain” controls.
Here is an example of relative dB levels. First set the volume control at the left to a low setting, to where you can still hear the 0 dB level. Then push each of the buttons in succession to hear the sound attenuated progressively by 6 dB. You’ll probably only hear the first couple of buttons before the sound dies out completely. Repeat the exercise but with the sound fader towards maximum (be careful your external amplifier isn't too loud). You should be able to hear the entire range of sounds.
| dB: |
We don't have any idea how intense the sound pressure will be at the listener's ears, since there are many different elements in the communication chain between the information stored in the computer and the listener. A digitized sound can be represented as a floating point number 0.565, or a signed integer 28363, but we’ll never know the actual sound level since we have no idea what levels are involved with the playback system.
The absolute, as opposed to relative, intensity of a sound wave is expressed as the dB sound pressure level, abbreviated dB SPL. A dB SPL is a way of expressing the ratio between two intensities. The ratio of interest is between the lowest audible intensity recognizable by an ideal hearing system (e.g., a newborn’s) and the intensity of the sound we wish to measure:
dB SPL = 20 log10 ( p1 / p2 )
For dB SPL, p2, or 0 dB, is equivalent to a sound pressure level of 0.000002 newtons/meter2. This relates incoming levels to a previously-agreed upon reference level of 0 dB that is roughly equivalent to the threshold of hearing.
The way to measure p1 in the equation above is with a dB SPL meter. This is a useful device for measuring absolute as opposed to relative sound levels of your audio system, your neighbor’s dog barking, or the aircraft flying overhead that keeps you awake a night. To perform some of the audio tests in Chapter 8, you’ll want to purchase an inexpensive one.
Many books have charts of typical SPL levels; generally, the quietest dB SPL we experience in anywhere but rural or wilderness areas might be 30 dB SPL in a recording studio; a conversation is around 60 dB; instrumental music can get up to 100 dB SPL, and things get painful around 120 dB. You can determine the era that these charts were designed in by whether or not “rock band” is used as an example near the threshold of pain. The measurement of dB SPL is also influenced by different possible weighting scales and the distance of where the measurement was taken from the sound source. In non-reflective environments, SPL falls 6 dB with each doubling of distance.
You're probably most familiar with intensity adjustments in terms of a volume control (properly, a potentiometer). For instance, the following represents increments of waveform intensity, from 0—7, that are typical of computer control panels. Push each of the buttons, in sequence:
0 |
Now compare these levels to levels that we know are 6 dB apart. Set the volume slider to maximum, and then play 7 (above) and 0 dB (below). They’re at the same intensity. But what about 6 and -6 dB? 3 and -24 dB?
| dB: |
The 0—7 scale is used on the Macintosh for adjusting the volume of system beeps ('alerts'), and other sources such as games or audio CDs. The volume slider at left used throughout this book results uses this same scale. The scale functions to adjust the relative volume of the various sounds contained within a source recording. Like the numbers printed on the volume control of a portable tape recorder, this particular scale represents an arbitrary system: the numbers don't really mean anything except that there's a relative loudness increase with larger numbers. The number system doesn't help when trying to make something sound “twice as loud.” For example, click 2 and then click 4. Does 4 sounds twice as loud as 2? Now click 2 and then 6. Does 6 sound three times as loud as 2? More than likely not.
Since there's a chain of events within an audio system that can change the overall level, we'll never have an absolute idea of the final loudness at the end of the chain. If the output of the computer is connected to a stereo system or powered loudspeakers, there'll be separate volume controls at least two locations: on the computer and on the audio system.
While Macintoshes are fairly consistent in terms of internally-set audio levels, the situation is less predictable on a PC since it depends on the particular third-party sound card and software driver that was installed. Another interesting difference between Windows and Macintosh operating systems is that the final relative level on the Macintosh is controlled by the volume slider seen throughout this website, while with Windows 3.1 the volume you set with this slider or from any application can potentially be one of several volume controls that interact. This is less of a problem with Windows 95 since there is a master volume control for all devices. However, some sound cards have an additional “output gain” control that scales the overall output voltage.
Loudness is the perceptual correlate of intensity; they're not the same thing, although many people get them confused. The loudness of a waveform varies widely as a function of frequency. Furthermore, the relative loudness across frequency is different at loud playback levels, compared to quiet ones. For sine waves, equivalent loudness contours can be looked up on an equal loudness contour graph (see Figure 2.3). The contours on this graph represent equal loudness for a given SPL level. For instance, a tone at 60 dB SPL is not as loud at 200 Hz as it is at 4000 Hz. Not surprisingly, the majority of the frequency content of speech (approximately 100 Hz· kHz) is within the part of the curves that show maximal sensitivity. Note that with the lower dB SPL contour lines, sensitivity to low frequencies is lower than with higher frequencies, but at higher SPLs, the contours are more linear. The loudness and “bass boost” buttons found on consumer audio equipment are designed to compensate for this decrease in sensitivity to low frequencies at low sound pressure levels.
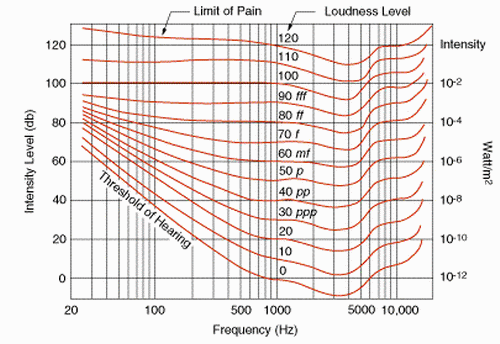
FIGURE 2.3. Equal loudness contours. The contours show, for a given dB SPL, how equal loudness levels vary as a function of frequency.
The two most important aspects of intensity in the process of capturing and transferring audio material can be described as either having “not enough” or “too much” signal intensity. Figure 2.4 illustrates the problem of matching dynamic ranges between different mediums. If the intensity of a waveform is too small, all or some portion of its energy will be masked by the noise floor of the system or the environment. If you have external speakers it's possible to exceed the dynamic range and push the signal into distortion, by overdriving the speaker cones or the built-in amplifiers. This also involves the levels used with recording equipment, which is covered in more detail in Chapter 5. Note in Figure 2.4 that the noise floor of most playback environments (except a recording studio) is around 40 dB.
When the intensity of a waveform goes beyond the electrical tolerance of any part of a circuit, distortion in the form of clipping results. As seen in Figure 2.5, the red portion of the waveform is the portion that is clipped, causing a “flattening out” of the top of the triangle waveform. This results in additional inharmonic partials being introduced to the waveform. In some cases this is desirable, for instance with certain electric guitar sounds or other electronic instruments.
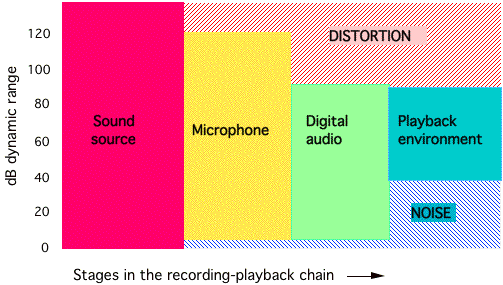
FIGURE 2.4. Illustration of waveform dynamic range, comparing the natural range in dB, the range captured by the recording system, and the ranges of “too much” (distortion), and “not enough” (noise). Note that by changing the relative level of a signal from one stage to another, it can be brought within range. Another means of accomplishing this is via compression (see Chapter 7).
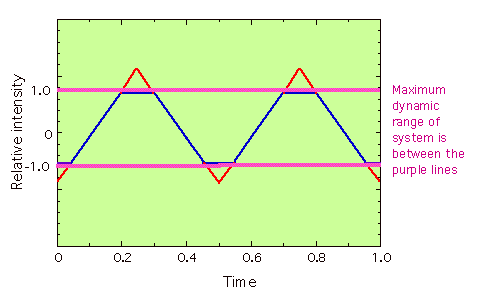
FIGURE 2.5. An illustration of distortion of a triangle wave. The triangle waveform is clipped at the point where the waveform is shown in red, where it exceeds the maximum dynamic range of the audio system.